Animating a scatter plot.
Gif is a fancy way of data vizualization. It facilitates communication, makes your audience active.
- What do I need to do to produce gif? First load the packages we need. If you don’t have these packages install them.
Load the data
library(readxl)
type2pre <- read_excel("F:/github/githubwebsite/type2GBDcompare.xls")
View(type2pre)
Source of data
The data is about prevalence of type 2 diabetes for 20 countries from 1990-2017
# You can downloaded such data from the IHME GBD compare websisite. You can select any indicator(prevalence, DALYs, mortality, etc). Check their website [GBD](https://vizhub.healthdata.org/gbd-compare/)

#We will plot prevalence
is.factor(type2pre$Year) #to check whether year is coded as numeric variable
[1] FALSEtype2pre$yearfactor <- factor(type2pre$Year) #To save year as factor variable
type2pre$Yearnum <- as.numeric(type2pre$Year) #To save year as numeric variableInstall the necessary packages
To install the latest version of the packages
library(devtools)
- NB if you don’t have the necessary packages, you need to install them with the following codes
devtools::install_github("thomasp85/gganimate")
devtools::install_github("thomasp85/transformr") transformr is a dependency that helps you with transitions for polygons and lines.
Load the necessary packages
The plot
#Basic ggplot
myplot <- ggplot(type2pre, aes(x=Yearnum, y=Prevalence)) +
  geom_point(aes(color=Location, size=3))

myplot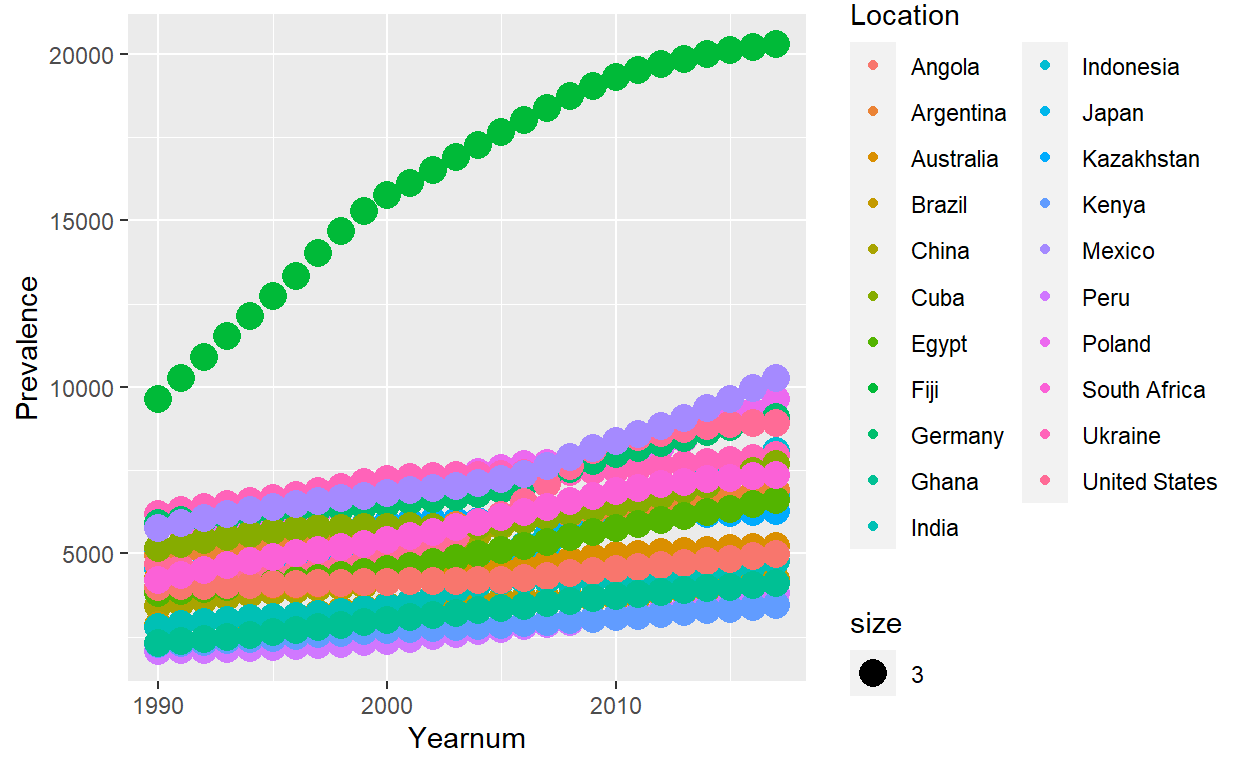
## the gganimate part of code
animateplot <- myplot + transition_time(Yearnum) +
  shadow_mark() + scale_x_continuous(limits = c(1990,2017)) +
  xlab("Year") + ylab("Prevalence per 100,000")

##NB: The shadow_mark() function is to include the previous plots in the scatter plot.Then each point moves across the variable that passess through the transition_time() function
## the animation is done by passing the ggplot on the animate function of gganimate
animate(animateplot, width = 700, height = 500)
*There are a lot you can do with gganimate. Google for more!
References
- https://github.com/thomasp85/gganimate#old-api
- https://paldhous.github.io/ucb/2018/dataviz/week14.html
Contact
Please mention MihiretuKebede1 if you tweet this post.